Four months after the December update of the search algorithm core, Google launched its first major update of the core algorithm in 2026: March 2026 Core Update.

The update was announced on March 27, and its implementation ended on April 8, lasting just under two weeks. It has led to more diverse and less consistent trends than previous core updates: YouTube has shown the greatest loss of visibility, and there has also been a significant decline in visibility in the categories of social networks, aggregators, and reference resources, which have held leading positions on Google’s organic search results pages for the better part of a decade.
During the updates to the search algorithm core, Google is looking to improve the overall quality and relevance of its search results by re-evaluating and adjusting how its main ranking systems evaluate various quality signals on the internet. The March 2026 update is a continuation of this work, and when analyzing the biggest winners and losers in terms of organic visibility, some interesting trends can be observed.
If December 2025 could be considered primarily as a reboot of the e-commerce niche, then March 2026 looks different: this is an adjustment in favor of primary sources and official sources, in which Google shifts visibility towards reputable, brand-owned, and government-owned domains — and away from user-generated content, comparison aggregators, and content created primarily for search visibility (SEO content).
Below is a breakdown by the biggest winners and losers, the category-level patterns evident in the collected data, and what it all means for SEO professionals in the rest of 2026.
- Methodology
- Leaders in maximizing visibility in Google organic search
- Leaders in maximizing increased visibility in percentage terms
- Outsiders in terms of maximum reduced visibility in Google organic search
- Outsiders by maximum percentage drop in visibility
- Main trends
- Impact of Google algorithm updates by category
- The Art and Entertainment category is the leader among all categories showing a drop
- Travel and tourism: leaders among branded websites
- “Work and Education”: aggregators are losing ground, employers’ websites and government resources are growing
- Health: Official sources are growing, even leading YMYL sites are losing ground
- Finance: victory of government sites, defeat of partner sites
- Clothing: mid-range stores outperform department stores
- Final analysis of winners and losers from the March Google update 2026
Methodology
By analyzing the SISTRIX visibility index data, you and I can see instantaneous absolute and percentage changes in organic visibility for sites that showed the greatest fluctuations as a result of the update. For this analysis, SISTRIX generated four rating lists based on the data obtained:
- 500 sites with the highest percentage growth (the highest percentage increase in visibility).
- 500 sites with the largest percentage drop (the largest percentage decrease in visibility).
- 500 leaders in absolute growth (the largest increase in visibility in absolute numbers).
- 500 outsiders by absolute drop (the largest decrease in visibility in absolute numbers).
To go beyond the domain level, SISTRIX classified all 2,076 unique domains using Google product taxonomy categories through the DataForSEO API. This allows us to see which types of sites are winning and losing at the category level, not just which individual brands have changed their positions.
Several reservations at once: SISTRIX measureskeyword-level visibility, not raw organic traffic. The dates being compared — March 27, 2026 and April 8, 2026 — are quite close to the launch of the update, so algorithmic changes are probably the dominant factor, but other factors (changes in tracking, indexing, updates on the site) Traffic visibility and trends can also be affected. As always, the introduction of SEO improvements is just one of many variables that affect the development dynamics of any single website.
Now let’s look at the biggest winners and losers.:
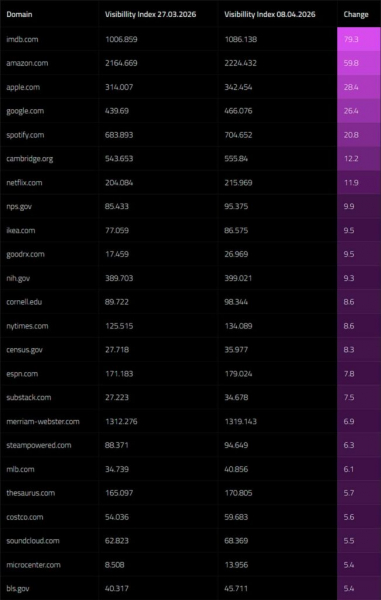
Leaders in maximizing visibility in Google organic search
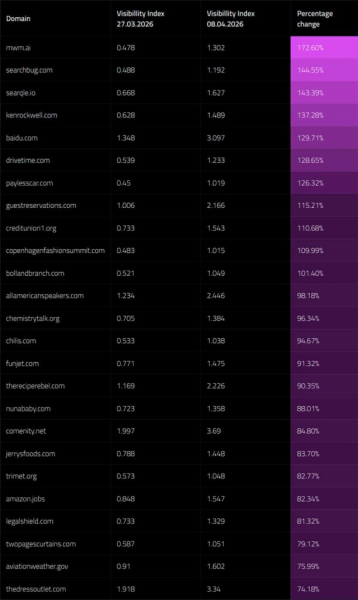
Leaders in maximum visibility growth in percentage terms
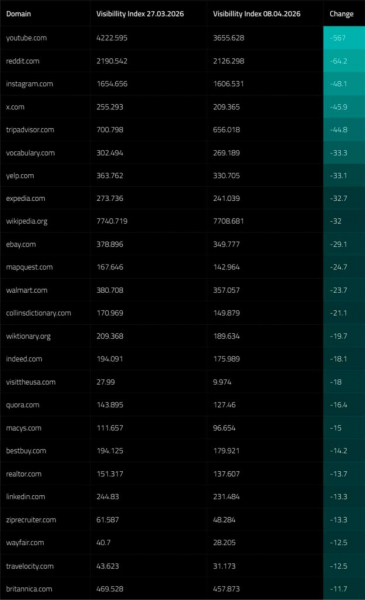
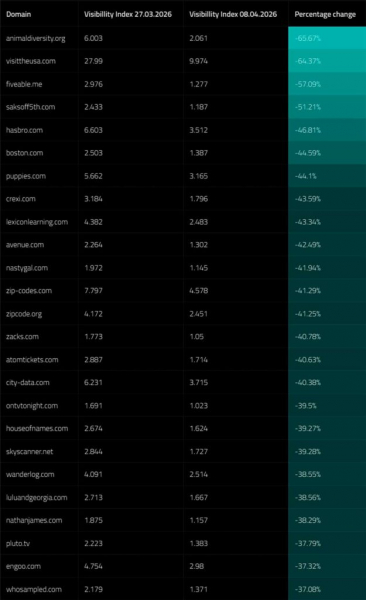
Outsiders in maximizing visibility in Google organic search
Outsiders by maximum percentage drop in visibility
Main trends
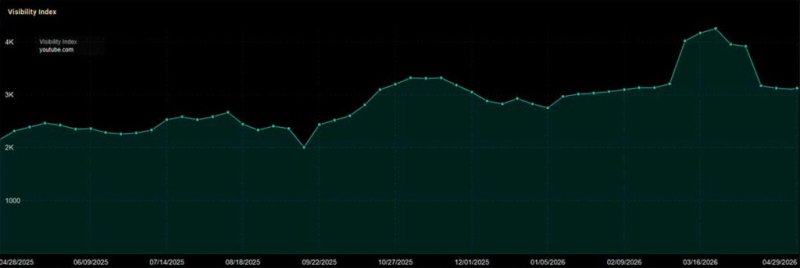
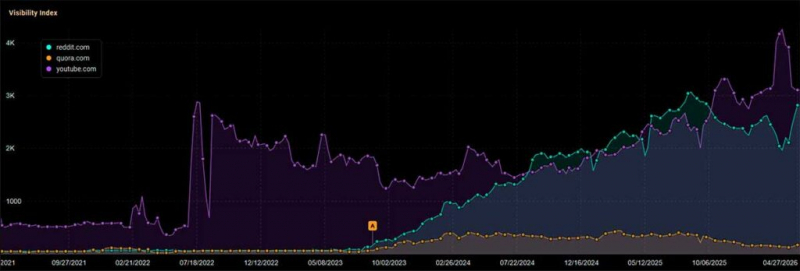
The most high-profile event of this update was what happened to YouTube. The 567—point drop in visibility in less than two weeks is simply staggering – there is practically nothing comparable in recent history for a domain of YouTube’s scale.
For comparison, Wikipedia’s massive drop of 435 points in December 2025 was the largest loss of the previous year, while YouTube’s decline in March 2026 is approximately 30% higher than this figure. However, if we look at the situation in context, YouTube’s visibility has returned to the level it was at before the surge in early March 2026:
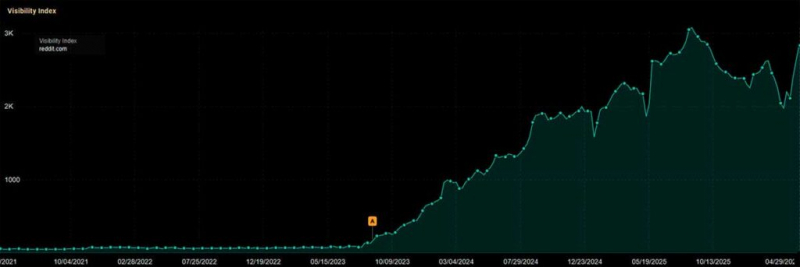
All other sites at the top of the list of absolute outsiders confirm the same trend: Reddit, Instagram and X are the three pillars of the rapid growth of user—generated content and social networks that defined organic search results from 2023 to 2025 — all of them suffered significant losses after the March update.
In the tourism sector, TripAdvisor, Yelp and Expedia have suffered greatly. Even Wikipedia has returned to the list of losers, although much less seriously than in December.
This pattern is repeated in all categories.: With the major update in March 2026, Google seems to be reducing the visibility of platforms that aggregate, host, or distribute other people’s content, while boosting the position of the sites that originally created it.
This marks a major reversal from the trends you and I have seen in previous updates, or perhaps an over-adjustment.
However, it is important to note what happened in the weeks following the major update, when Google apparently reversed this trend, particularly with regard to Reddit:
The flip side of the YouTube story is the growing popularity of brands’ own media resources. IMDB, Amazon, Apple, Spotify, and Netflix have significantly increased their visibility — these resources are the key players in the entertainment ecosystem, not aggregators or websites that write about them.
Government domains, such as NPS.gov , NIH.gov , Census.gov , BLS.gov , FDA.gov , IRS.gov and Treasury.gov, invariably appears in the list of winners of this update.
GoodRx, Cambridge.org , IKEA and Cornell University was also included in the list of winners, which is dominated by sites with clear authority and their own expertise on the topics they are ranked on.
These data show a clear separation: the top of the list of winners is almost entirely made up of “companies that own the facility“. The top of the list of losers is almost entirely made up of “platforms that people use to discuss the object“.
The impact of Google algorithm updates by category
A summary of the four ranking lists by category of Google’s product taxonomy shows in which areas the impact of the update was most noticeable. Some categories deserve separate detailed consideration:
The Art and Entertainment category is the leader among all categories showing a drop
The “Arts and Entertainment” category occurs 147 times in both lists of categories that showed declines, which is by far the largest concentration of declines in this update. However, the decline in this category does not occur uniformly.
There is a clear separation:
Winners in the Art and Entertainment category: proprietary platforms and major intellectual property owners: IMDB (+79.3), Amazon (+59.8), Apple (+28.4), Spotify (+20.8), Netflix (+11.9), Substack (+7.5, +27%), TikTok (+5.0), Medium (+4.7), PBS, Goodreads, Discogs, Grammy.com (+45.8%), Fox News (+48.4%).
Losers in the field of art and entertainment: user-generated content (UGC), social media sites, and the entire layer of sites offering “what to watch” recommendations: YouTube (-567), Reddit (-64,2), Instagram (-48,1), X (-45,9), Fandom (-10,7), Genius (-10,3), TheMovieDB (-9,5, -29%), Rotten Tomatoes (-8,5), Letterboxd (-5,2), AllMusic (-5,0, -18%), Famous Birthdays (-3,9, -20%), JustWatch (-3,8, -24%), OnTVTonight (-39,5%), Fandango, AtomTickets (-40,6%), WhoSampled (-37%), Pluto.tv (-37,8%).
Several sites that publish “what to watch” and similar content—sites that exist mainly to tell you where a movie is available to watch, when it’s on TV, or what other people think about it—were virtually wiped out by the Core Update in March 2026. of the year. Meanwhile, platforms that actually host content (Netflix, Spotify, Apple, Amazon Prime via amazon.com ), we won this time.
This continues the trend seen in the December 2025 analysis, when Google subtly adjusted overly indexed user content. The March 2026 update dramatically expands this trend, extending it also to entertainment content sites.
Travel and tourism: leaders among branded websites
The Travel category has become the leader in the number of sites showing the greatest growth (117 sites), as well as one of the categories with the largest drop.
The analysis of the distribution of results reveals an interesting picture:
Winners in the field of travel: hotel brands and official sources of travel information: NPS.gov (+9.9), Hilton (+4.0), Hotels.com (+3.6), Trivago (+3.2), Wyndham (+33.8%), IHG (+2.8%), Accor (+39.6%), Spirit Airlines (+69.8%), Omni Hotels (+19.0%), Southwest, MGM Resorts, Sandals (+23.4%), as well as impressive growth in airport websites: JFK Airport (+46.3%), LaGuardia Airport (+49.3%), Reagan Airport National (+59.6%).
Losers in the tourism sector: online booking agencies (OTA) and travel content aggregators: TripAdvisor (-44.8), Yelp (-33.1), Expedia (-32.7), MapQuest (-24.7), Travelocity (-12.4, -28.5%), Booking.com (-9.1), Lonely Planet (-4.6, -23.8%), Hotwire (-22.1%), Skyscanner (-39.3%), Wanderlog (-38.6%), HotelPlanner (-26.9%).
It seems that the algorithm update redirected many travel requests past the OTA level directly to the operators. Official travel website VisitTheUSA.com lost 64% of visibility, which may be either the result of a general decline in American tourism (that is, the site may be perceived as less relevant this year, which may reduce its visibility), and/or another example of how Google prefers sites. where the user can perform a direct action (book a room, buy a ticket, see the opening hours of the park), and not just get acquainted with the description of the tourist experience.
“Work and education”: aggregators are losing ground, employers’ websites and government resources are growing
In the “Work and Education” category , 103% of sites showed growth, while only 20% showed a drop; this is one of the most obvious positive imbalances in this update.
Winners in the category “Work and Education”: government resources, universities and employers’ career websites: BLS.gov (+5.4), USAJobs.gov (+16.3%), Ed.gov , SNHU, UNC, MyWorkdayJobs (+46.2%), highleredjobs (+46.3%), Randstad USA (+38.6%), SnagAJob (+69.9%), Brown University (+24.7%), Disney Careers (+58.5%), CVS Health Careers (+44.6%).
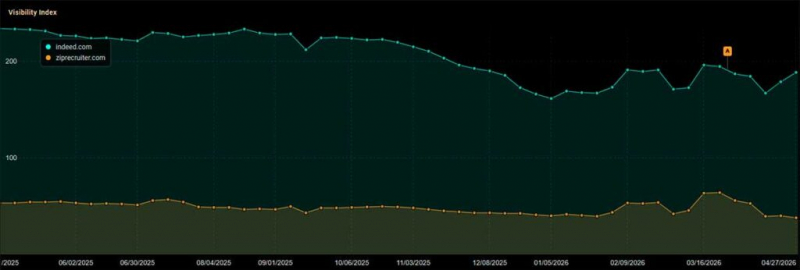
Losers in the field of work and education: classic job aggregators: Indeed (-18.1), ZipRecruiter (-13.3, -21.6%), Niche.com (-6.9), Glassdoor (-4.5, -21.7%), GreatSchools.org (-19.0%), CollegeVine (-27.3%), SimplyHired (-29.1%), Monster, Appily (-19.1%).
It is worth noting: although Indeed recorded a drop after the March update of Google’s search algorithm, as well as Reddit, in the weeks following the update it also demonstrated recovery:
Health: official sources are growing, even leading YMYL sites are losing ground
The “Health” category (82% of winners, 34% of losers) shows a more complex picture that is worth exploring in more detail:
Winners in the Health category: GoodRx (+9.5, +54.5%), NIH.gov (+9.3), Harvard.edu (+5.3), CVS.com (+4.3, +16.7%), WHO.int (+3.7), Cancer.org (+3.5, +34.3%), Nature.com (+3.5, +24.1%), Medscape (+3.3, +16.9%), AARP, FDA.gov , HealthDirect.gov.au .
Losers in the healthcare sector: this time, even some of the most reputable sources in the YMYL field suffered losses: Cleveland Clinic (-11.5), MedlinePlus.gov (-10.4), WebMD (-9.1), Mayo Clinic (-6.1), Johns Hopkins Medicine (-5.2), KidsHealth.org (-19.4%), NHS UK (-4.3), Cancer.gov (-4.0%), Healthline (-3.3%) and Merck Auto (-18.8%).
The list of healthcare winners leans heavily towards government and non-profit primary sources, professional and academic websites, as well as specific transactional brands (GoodRx for prescriptions, CVS for pharmacies).
The losers were major consumer-oriented healthcare sites, which have held a leading position in medical SERPs since the initial Medic update in 2018. This is a significant change in how Google ranks search results: with the Core Update in March 2026, Google seems ready to downgrade even sites with high E-E-A-T in favor of the reputable sources they link to.
Finance: government websites win, partner websites lose
The same pattern is repeated in the financial sector.:
Winners in the field of finance: StudentAid.gov (+4.0, +28.6 %), AmericanExpress.com (+3.0, +23.2 %), IRS.gov (+2.1), SBA.gov (+2.1), NavyFederal.org (+2.0, +18.5%), FTC.gov (+1.9), Treasury.gov, Comenity (+84,8%), TheStreet (+65,4%).
The losers in finance are NerdWallet (-4.3, -15.9%), CreditKarma (-2.7, -34.2%), Nasdaq (-23.2%), TradingView (-15.3%), MotleyFool (-32.1%), Experian, corporatefinanceinstute (-23.0%), Zacks (-40.8%).
This is a continuation of a broader trend according to which “Google is moving away from the comparative content of partner sites” — this pattern has been observed since the introduction of updates to “Useful Content” and “Product Reviews”.
NerdWallet and CreditKarma have demonstrated resilience during previous updates; their decline in this case, along with a simultaneous increase in positions IRS.gov , SBA.gov and the brand websites of issuers such as AmericanExpress and NavyFederal indicate that Google is increasingly directing users to the source of the financial product, rather than to comparison pages or partner sites.
Clothing: mid-range stores outperform department stores
Leaders in the clothing segment: Coach (+57.4%), Simon (+17.0%), Gap Factory (+29.9%), The Dress Outlet (+74.2%), Express, Abercrombie, Kohl’s, ASOS (+18.5%).
Losers in the clothing sector: Macy’s (-15.0), Nordstrom (-3.2), JCPenney (-1.9), Lulus (-26.7%), Kay (-16.6%), Bloomingdale’s (-18.4%), Carter’s (-19.9%), Aritzia (-28.1%), Saks Off 5th (-51.2%), Avenue (-42.5%), NastyGal (-41.9%).
The results show a mixed picture: mid-range brands in shopping malls and outlets showed improved performance, while traditional department stores continued their long-term decline.
Final analysis of winners and losers from the March Google Update 2026
Based on this dataset, several general trends stand out that should shape the SEO discussions in the coming weeks and months.:
1. Aggregators find themselves in a more difficult situation than they were a few months ago. The March 2026 update indicates that in almost all categories, Google is redirecting traffic past sites that index, list, or comment on third-party content.
Comparison sites, online hotel booking agencies (OTA), job bulletin boards, review aggregators, and “what to see” tools are all facing a reduction in their competitive advantages. The answer to the challenge of competitors here is not to improve SEO, but to create a stronger product. Reasons for visiting again, the possibility of making transactions, your own data and verified user content are increasingly becoming mandatory conditions.
This is in close agreement with a similar study recently conducted by Cyrus Shepard: Cyrus’ analysis of more than 400 sites showed that organic traffic leaders are more likely to offer a product or service, allow users to complete tasks, own their own assets, have a clear thematic focus, and demonstrate higher demand for the brand.
These findings are more indicative than causal, as they are based on estimates of third-party traffic, but this pattern indicates that Google may be encouraging sites that provide clear value beyond information content alone.
2. Our own brands have a chance. Hotel chains, airlines, consumer brands, employers, financial institutions, and government agencies have all strengthened their positions thanks to this update. Brands may have a new opportunity to regain positions that were previously considered lost in favor of aggregators.
3. The signal “refer to the original source” is getting louder. In the fields of travel, employment, finance, healthcare, and entertainment, Google seems to put primary source domains-real hotels, real employers, real issuers, and real streaming platforms—above secondary comments. For a content strategy, the value of first-hand expertise, primary sources, and original data continues to grow.
4. User-generated content volatility is a common occurrence with every major Google update. Reddit, Quora, Wikipedia, and YouTube have lost significant weight in various updates over the past 12 months. However, most of these sites have shown a huge increase in visibility, so these declines have hardly affected their overall growth trajectory in recent years:
As always, website owners should focus on comprehensive quality improvement in all aspects of their resources, giving preference to real benefits for users rather than short-term optimization tactics.
Over time, changes in Google’s algorithms will continue to encourage this approach, even if specific leaders and outsiders in individual categories change from update to update.
Data source: amsive.com .